Show Graph displays an insights panel that visualizes your data with charts and trends. This feature is available on list views across infoodle and helps you understand patterns in your data at a glance.
Access Show Graph
Show Graph is available on the following list views:
![]()
To open the insights panel:
- Navigate to the list view (People, Transactions, or Assets)
- Click Show Graph at the top of the page
- The insights panel opens at the top, displaying a chart based on your current filters
People Insights
Visualize data about your contacts and their activity.
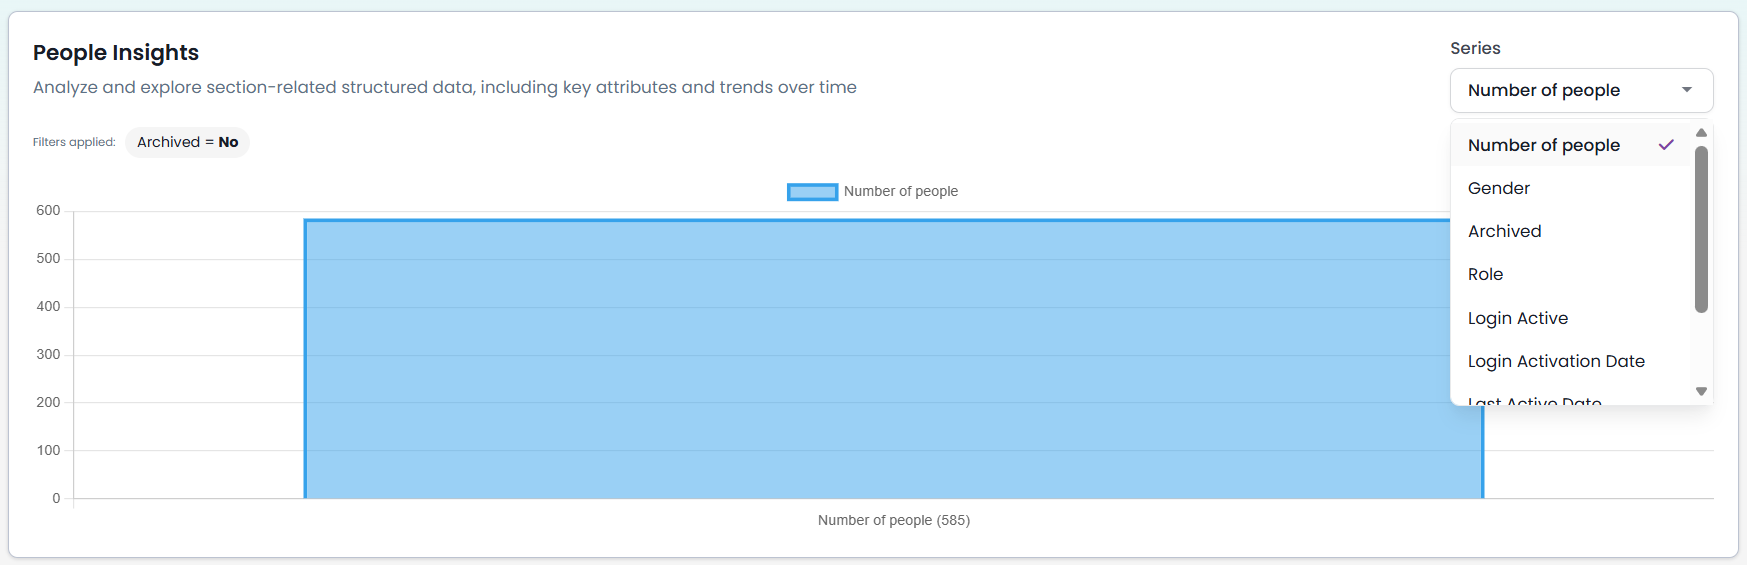
- Click Show Graph on the People list view
- Use the Series dropdown to choose what to display:
- Number of people — count of contacts matching your filters
- Gender — breakdown by gender
- Archived — comparison of archived vs. active contacts
- Role — distribution across different roles
- Login Active — who has logged in
- Login Activation Date — when users first activated their account
- Last Active Date — when users last logged in
- Receipt options — receipt-related data
- The chart updates to show your selected series
- Click Show Graph again to close the insights panel
Transactions Insights
Visualize patterns in your transaction data.
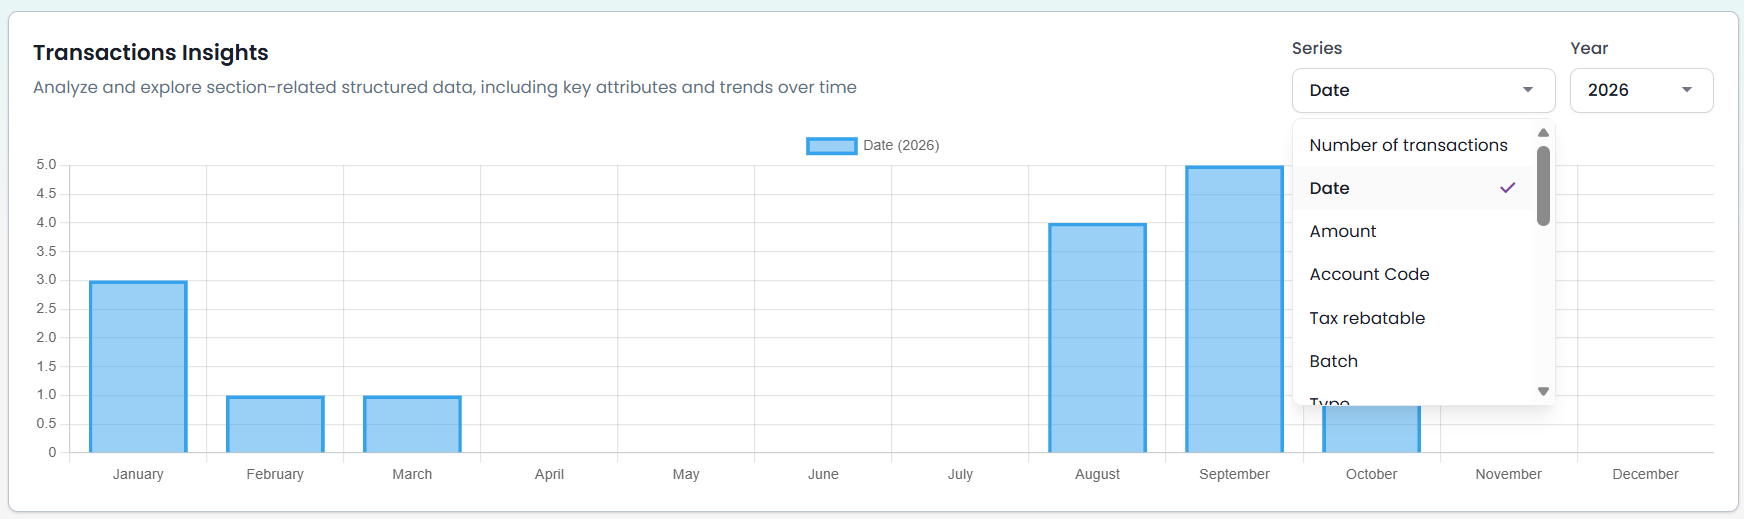
- Click Show Graph on the Transactions list view
- Use the Series dropdown to choose what to display:
- Transaction ID — individual transaction details
- Date — transactions over time
- Amount — transaction amounts and trends
- Account Code — breakdown by account code
- Batch Code — grouping by batch code
- Type — transaction types (e.g. donation, payment)
- Stock Code — product or stock breakdown
- Pledge Drive — transactions linked to pledge drives
- Event — transactions linked to events
- Ticket — ticket-related transaction data
- The chart updates to show your selected series
- Click Show Graph again to close the insights panel
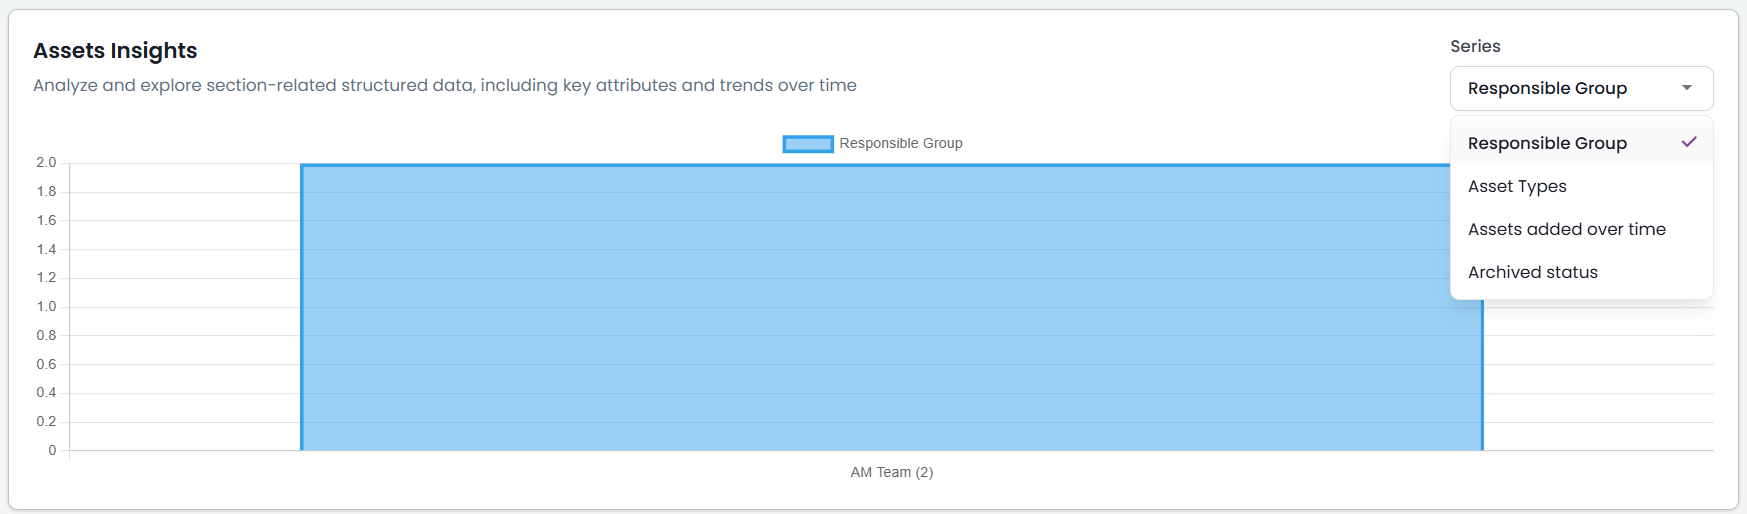
Assets Insights
Visualize data about your assets and their organization.
-
Click Show Graph on the Assets list view
-
Use the Series dropdown to choose what to display:
- Responsible Group — assets grouped by the person or group responsible for them
- Asset Types — breakdown of asset types in your inventory
- Assets added over time — trend showing when assets were added to your system
- Archived — comparison of archived vs. active assets
-
The chart updates to show your selected series
-
Click Show Graph again to close the insights panel
Tips for using Show Graph
- Combine with filters — use search filters to focus on specific data segments, then view the graph to see patterns within those segments
- Switch series quickly — experiment with different series options to find insights that matter to your organization
- Export filtered data — graph data respects your filters, so you can filter and graph a specific subset of records