Finance Reports are the ready-made reports that live in the finance area of infoodle. They summarise your recorded transactions: totals over a date range, breakdowns by account code, campaign or payment type, pledge progress, and lists you can match against your accounting system. They are the finance team's overview of the money that has come in and how it has been reconciled.
Three related articles cover neighbouring ground, so it is worth knowing which one you want. People Finance Reports are ordinary People reports with giving data added, used to report money against individual people. Batch Reports summarise a single processing batch. Lapsed Donors is one specific People report that finds people who used to give and have stopped. This article covers the reports in the finance area itself, which summarise transactions across your site rather than person by person.
Before you start
Role Permissions
To open Finance Reports your role needs:
- Access to Finance area
- One of the finance reporting permissions: Manage, Read and report on transactions or Read and Report on Transactions
For what each permission means and how an administrator turns it on, see About Permission Roles.
You will need transactions already recorded and reconciled in infoodle for the reports to return figures. A report run over a period with no processed transactions generates successfully but shows no data.
Opening Finance Reports
Click or hover on Finance on the main menu bar on the left, then click Finance Reports. The page opens on a set of report cards grouped by purpose.
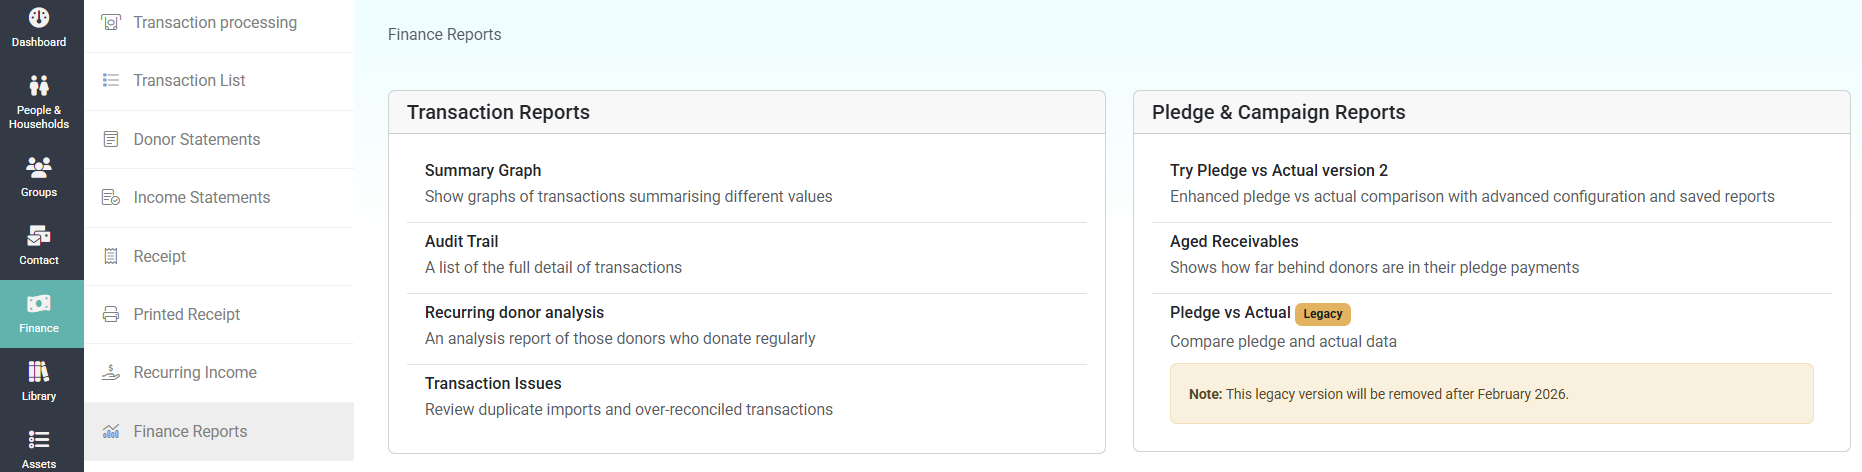
The reports available
The reports are grouped into cards. Some reports only appear once they have been set up for your site, so your page may show fewer than the full list below.
Transaction Reports
- Summary Graph: an overview of your finances as a graph or a table. Choose the period, how the figures are grouped (by month, account code, payment method and so on), and download the table if you want the underlying numbers.
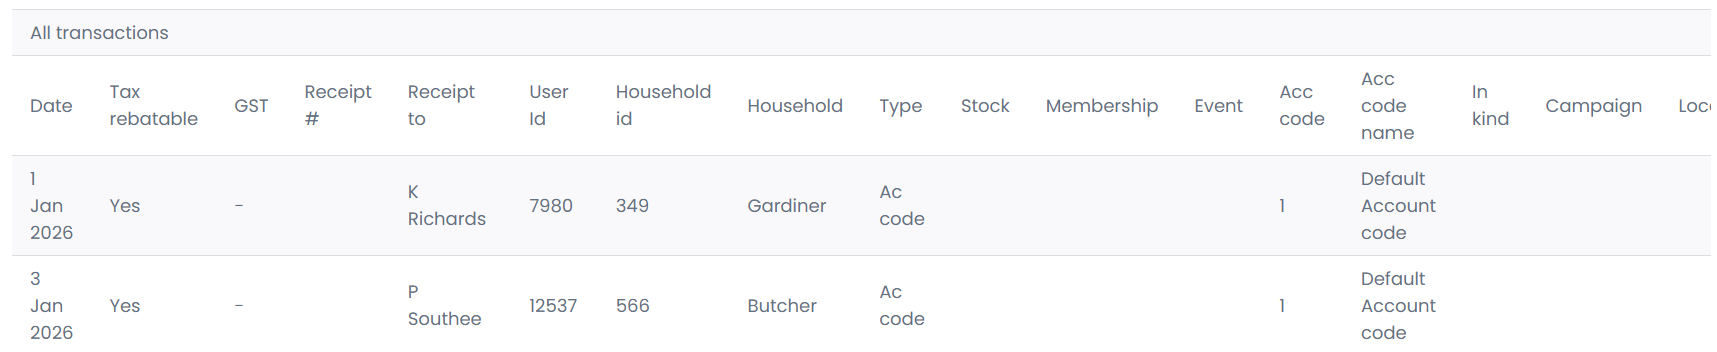
- Audit Trail: a full list or totalled view of transactions for a date range. This is the report most people use to match infoodle's figures against their accounting system. You can generate it on screen or download it as Excel or CSV.
- Recurring donor analysis: identifies who is giving regularly and how well they are keeping to it, including pledges. This report opens in the Recurring Income area rather than on the Finance Reports page.
- Transaction Issues: flags transactions that need attention, such as possible duplicate imports, over-reconciled and under-reconciled transactions, and transactions deleted in Xero.
Pledge & Campaign Reports
- Try Pledge vs Actual version 2: compares what people pledged against what they have actually given, with saved reports and configurable layouts.
- Aged Receivables: shows how far behind donors are on their pledge payments.
- Pledge vs Actual (Legacy): the earlier pledge comparison. It is marked Legacy and is being retired, so use version 2 for new reports. This link only appears on sites that still have the legacy report configured.
- Campaign Breakdown: finance data organised around your campaigns. This appears when a campaign breakdown report has been set up for your site.
Account & Category Reports
This card appears only when one of its reports has been set up for your site.
- Account Code Breakdown: finance data organised around your account codes.
- Tracking Category Balances: financial balances for Xero tracking categories. It appears only when your site is connected to Xero and tracking categories are in use.
Running a report
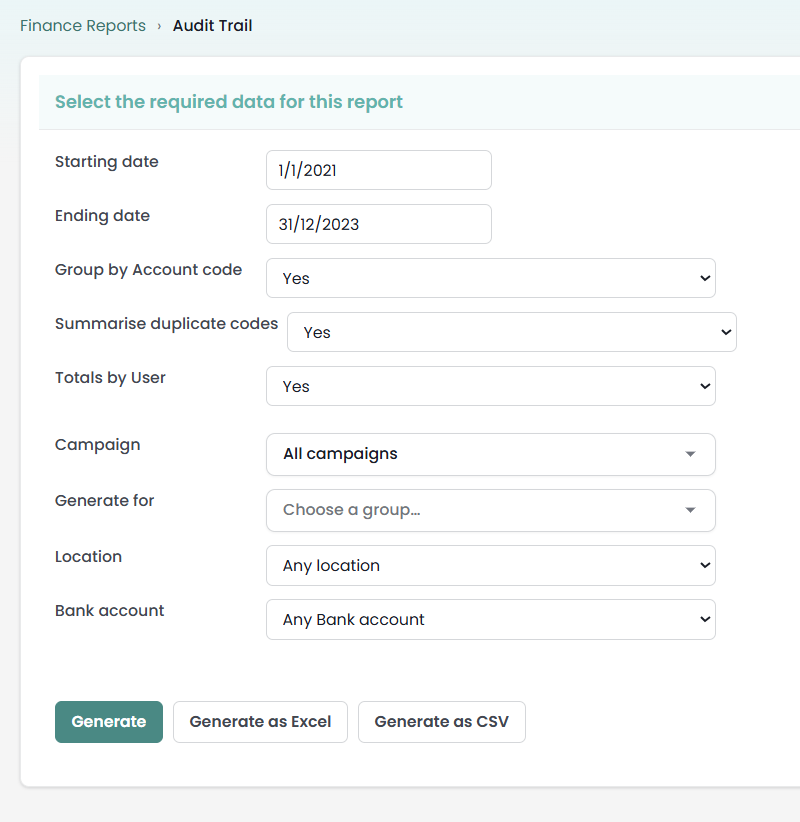
The reports follow the same pattern: open the report, set the options, and generate the result. The Audit Trail is a good example.
- On the Finance Reports page, open Audit Trail.
- Set the Starting date and Ending date for the period you want to report on.
- Choose your options. For the Audit Trail these include Group by Account code and Totals by User.
- Narrow the report further if you need to, using the Campaign, Generate for (group), Location and Bank account filters.
- Click Generate to see the report on screen, or Generate as Excel or Generate as CSV to download it.
The Summary Graph works the same way: pick the start and end period, choose how to report the figures and which lines to show, then click Show graph. You can download the underlying table or print the result.
How the figures are worked out
A transaction is processed, also described as reconciled, once it has been matched into a batch and confirmed against your bank or accounting records. Until it is processed it is only recorded, and it does not count towards these reports.
For how transactions are reconciled, see Reconciling Transactions.
- Reports summarise processed transactions. A transaction contributes to these reports from the point it is processed. Recording it on its own is not enough for it to appear in the totals.
- The date range drives the figures. The Audit Trail and Summary Graph report on transactions dated within the start and end dates you choose, so setting the right period matters more than any other option.
- Receipt Status is a filter, not a separate figure. On the Audit Trail, choosing Receipted or Not Receipted limits which transactions are counted; Both counts everything in the period.
- Recurring donor analysis uses reconciled transactions only. Its grid is built from transactions that have been reconciled, so unreconciled payments do not affect its pattern detection.
Common questions
Why is a report I expected missing from the page?
Some reports (Pledge vs Actual legacy, Campaign Breakdown, Account Code Breakdown, and Tracking Category Balances) only appear once they have been set up for your site. Tracking Category Balances also needs a Xero connection. If a report is not on your page, it has not been configured, so ask your administrator.
My report generated but showed no figures. Why?
The period you chose has no processed transactions in it. Widen the date range, or check that the transactions you expected have been reconciled.
Pledge vs Actual version 2 is asking me to set it up. What do I do?
The first time Pledge vs Actual version 2 is opened on a site it needs to be configured. If your role includes Create and manage forms and entries, you will see a setup screen where you can configure it. If it does not, you will see a message asking you to contact an administrator who has that permission. Once it has been set up, the report opens normally for everyone.
Should the totals match my accounting system?
Your figures should reconcile once all transactions for the period have been processed. The Audit Trail is built for this comparison, and the numbers line up with your accounts, particularly if you use Xero. A mismatch usually points to transactions that have not yet been processed or reconciled, or that fall outside the date range you chose.
Where do I report giving for individual people?
Use a People finance report, not the finance-area reports. See People Finance Reports in the related articles below.
Next steps
Once you have the figures you need, you can move on to receipting your donors or preparing donor statements. If you are chasing pledge shortfalls, the Aged Receivables and Pledge vs Actual version 2 reports show you who is behind.
Related articles: