There are a number of reports that are useful, please see below for an explanation of each.
Summary graph
The report provides you with ability to have an overview of the finances. You can
- View the data as a graph.
- View and download the data as a table.
- The data can be selected by date period.
- The breakdown of the graph can be by a variety of methods such as Account code, Method of payment, etc.
Audit trail
This provides the means to export finance data from infoodle, and use it as a quick way to check on total activity to assist you with matching the numbers with your other accounting systems.
- Click Finance on the Navigation menu.
- Click Analysis.
- Click Audit trail.

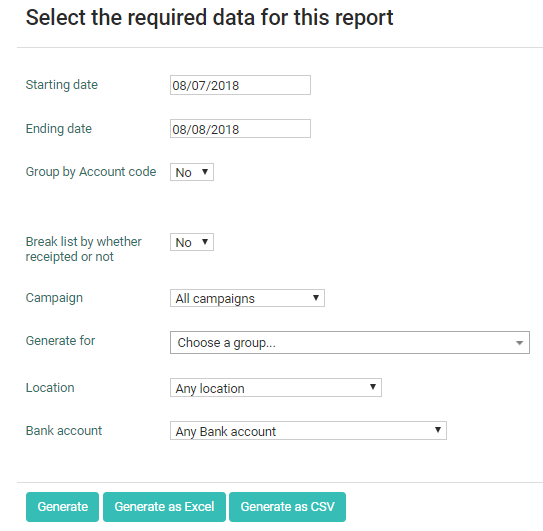
- Select the relevant start and end dates that you wish to report on.
- Select whether to Group by account code or not. If you select No then it will list each transaction individually.
- If you chose to group by account code you can choose whether to Summarise duplicate codes or not and also whether to Group by Tracking category or not.
- If you did not choose to group by account code then you can choose whether to Break list by whether receipted or not.
- Select a Campaign, a group, Location or Bank account if required.
- Click Generate to display the report on the screen or download as an Excel spreadsheet or CSV file. The numbers here should, for the most part, match your accounts, particularly if you use Xero.
Recurring donor analysis
The report is used to identify who and how well they are giving regularly and also includes pledges. Therefore as you record pledges either via a form, or on the persons finance / pledges tab, you can see the whole picture of your pledged income for the period you need.
The Recurring donor analysis report in infoodle reviews all the data identified by your filter (by default it is all data) and presents a grid of information.
There are two ways to get to the recurring donor analysis report. Either:
- Go to Finance then Recurring income then Donor Analysis or,
- Go to Finance then Analysis then Recurring donor analysis.
Each line shown is a person infoodle has determined gives regularly in some way. The following is shown:
- The person's name.
- Highlighted in green - the amount and frequency of the donations. The highlight starts the first month the recurrance is identified, and finishes on the last payment considered to be part of the recurrance.
- Highlighted in amber or orange - payments that have only missed one or two payments, therefore they may have stopped their donations this will only be detected at the end of the period, in the middle it will be shown as a negative variance.
- Highlighted in red - payments that have missed three or more payments this will only be detected at the end of the period, in the middle it will be shown as a negative variance.
- In smaller text above the highlighted amounts are
- any payments that were made that were not included in the recurring payments
- or could be a negative variance if they missed a payment
- or could be another recurring donation of smaller total amount per year
The far right shows the total amount identified assuming they donated regularly and in smaller text the amounts received outside of this. Note that the amount is the estimate if you had continued paying, even if you miss some at the end. However, there is no negative variance shown for the missing months.
This data only uses reconciled transactions.
On the Finance tab of the person's profile page, there are tabs with additional individual finance information.
Individual's Finance Activity
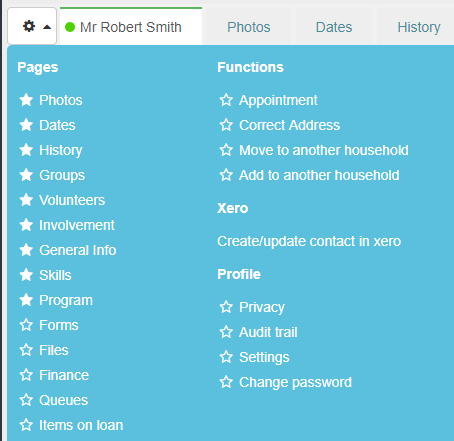
On the finance tab of the person's profile page, there are additional tabs with finance information for the individual. They show the individuals finance Activity, Pledges, Giving number and Donor Analysis. To view these Finance tabs click on the cog menu to the left of the persons name and then click Finance.
Activity

This screen displays a list of the individuals transactions and whether they have been receipted or not. Click Show Voided receipts to view all the voided receipts for this person which gives you the option to download the voided receipt if you wish to do so.
You can also export the transactions to PDF, CSV or Excel file by clicking EXPORT.
If the transactions have been allocated to the incorrect person, you can click on the
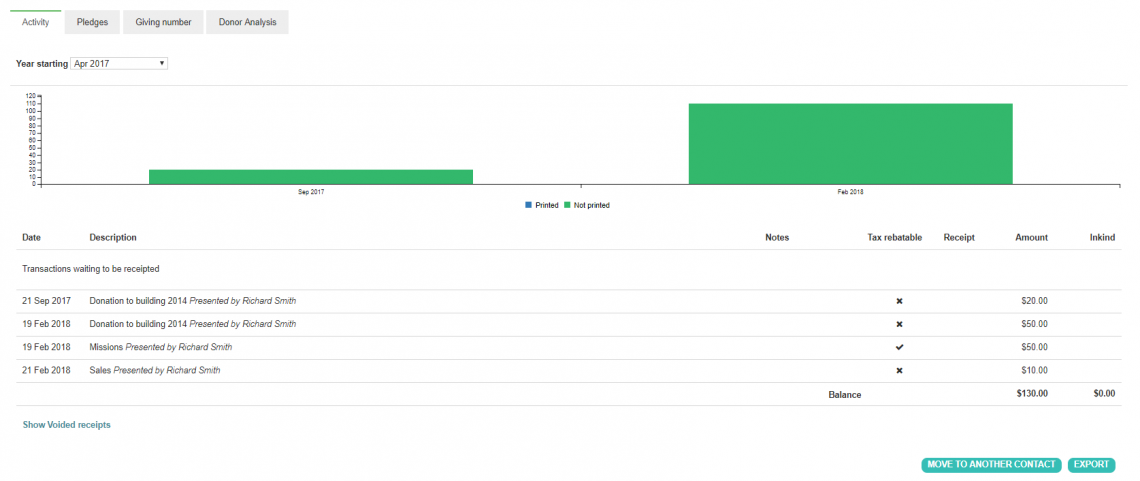 {height="" width=""} to allocate them to someone else. Note: this function will move all the transactions and not an individual transaction. To move an individual transaction go the Transaction Find function to find it and edit it to reconcile the individual transaction to another person.
Pledges
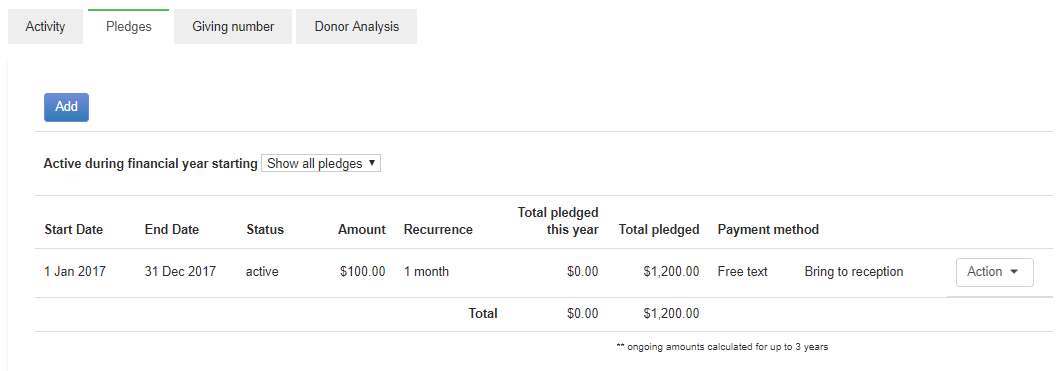
This screen includes Pledge data that appears via a form or manually added/edited/deleted on this page, as well as some filters so you can view those people who have missed regular payments.
Go to Pledges and recurring payments for more information.
Giving number
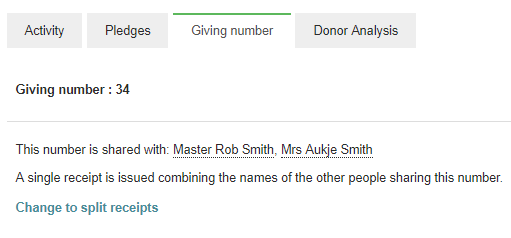
This screen shows if and who a giving number is shared with. You can click on the link to view their profile or change between issuing split or combined receipts for the people with shared giving numbers. Go to Giving Numbers for more information.
Donor Analysis
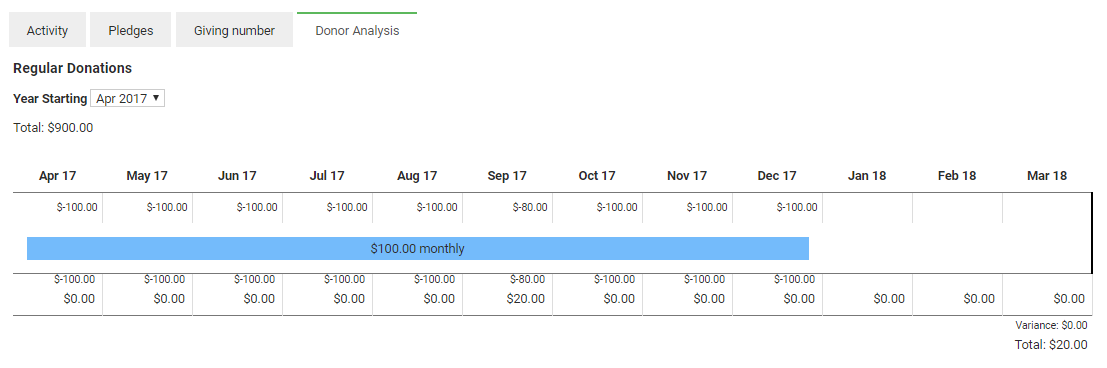
There are 2 purposes for this screen:
-
For donors, it shows your regular donations graphically, totals donated and whether they are missing.
-
For those receiving income, it shows the people who are giving your income, i.e. who your regular donors are.
More information on the donor analysis is found here.
Other reports
There are a number of reports that you can create yourself. Click here to find out how to create your own report.
An example of a report that you can create is how to find people who have not made a donation since a particular date? Click here to find out how to create this report.