Introduction to Reports
infoodle allows you to search and display information relating to various aspects of your organisation. However, Reports produce information with a large scale design in mind, and can be fine tuned to show just the information you're looking for.
When creating the report parameters, you need to consider who are you interested in, from where you want to obtain the data (for example, a group), how you might group that data together, and what information you want to display.
Selecting the Report type
Most reports are created using the same steps but there are some Special reports in infoodle which are slightly different. For example, Attendance.
-
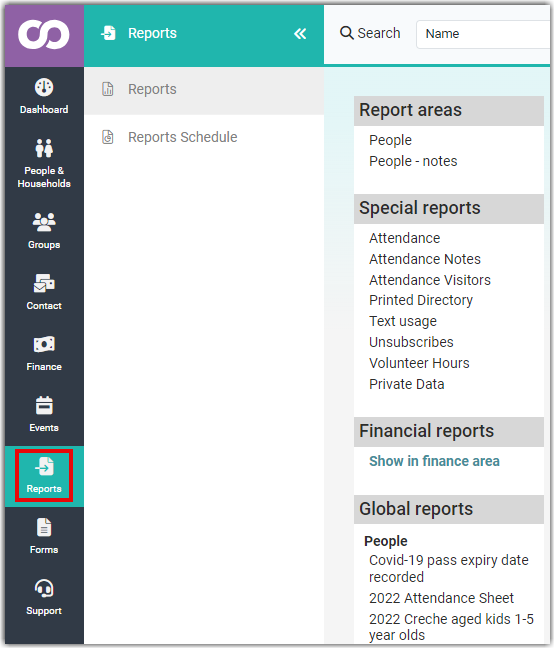
Select Reports from the Navigation Menu.
-
Select the type of Report to generate. Depending on the infoodle modules you've subscribed to, reports are generally based on People, Assets, Attendance, or People - Notes.
The ability to create People - notes reports is tied to the Notes options in Role permissions.
If a user's role does not have the permission Can see general people notes they will not have access to the People - notes report functionality at all, even if they can access People reports.
Similarly, if a person can see and report on Notes, but is not in the associated group that a Note maybe assigned to, any Note report they run will not list those Notes.
This is because the Visibility Access restrictions apply when viewing Notes System-wide - you can only report on Notes that you are ordinarily able to see.
The one exception to Note visibility is if a user has added the Note themselves, and set it as Visible to a Group, they will always see that specific note even if they are not part of that group. This is a very specific case where the person that added the note, is always able to see the notes that they have added, so long as their role has that permission enabled.
For further information regarding Roles and Notes, see Roles - Viewing Notes on other Contacts
Create Criteria
The Create Criteria tab is the starting point for selecting the data you want to display.
-
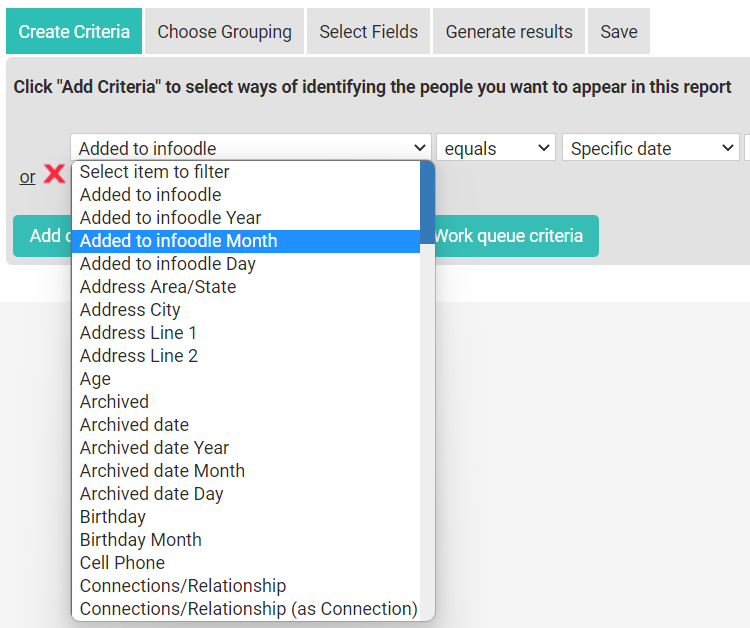
Select the drop-down and begin by choosing the criteria you want to add, or exclude from the report.
-
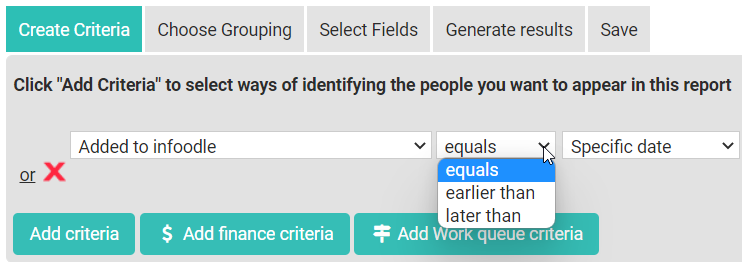
The second drop-down specifies range filters relative to the selected criteria.
In the example below, the options specify an exact date, all dates before, and all dates after the specified date.
Other criteria ranges may filter results with:
- starts with, ends with, contains (Address)
- starting or ending numbers (of phone numbers),
- equals or does not equal (Groups)
-
The third field will be either a drop-down box for the selection from a list of related filters (specific age year when the Criteria is Age), or a text box for text you want to search for (a road name when the Criteria is Address).
Depending on the initial Criteria, additional fields may also be displayed.
-
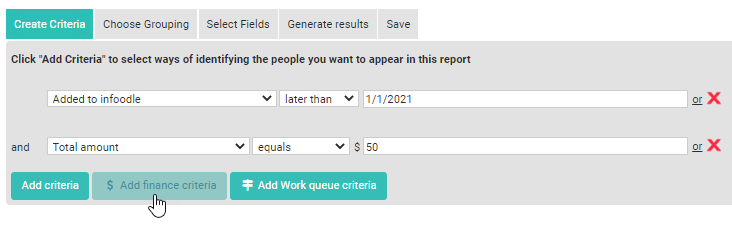
Continue adding Criteria using the Add Criteria button. This will provides the option of adding additional criteria with the AND function. This results in all people that meet all of the criteria. That is, people that are in both of groups (for example) - if they are not in both groups they will not be included in the results.
-
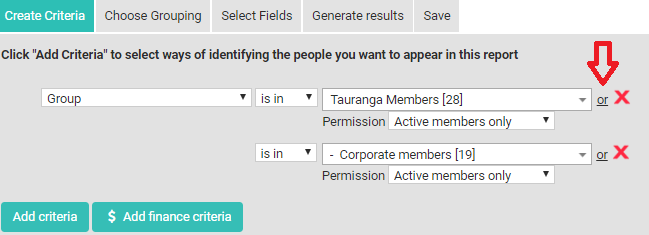
If you are looking for people in one or more groups then make sure that you use the OR function (as in the screenshot below). To select the OR function add one criteria and then click on the or button to add another criteria below.
-
For Finance information, set the criteria to select the people of interest, then add a financial criteria to include the financial information for those people.
-
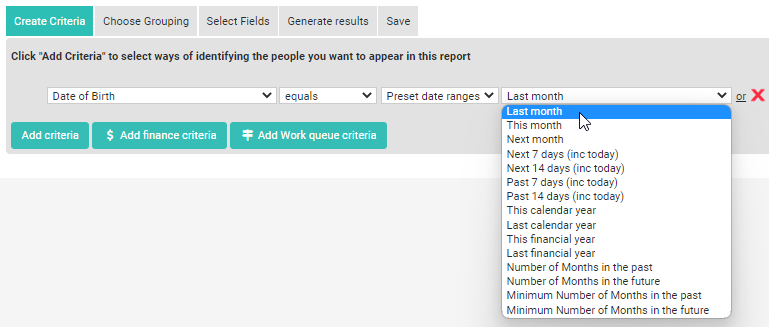
When you choose a date field, for example, Date of Birth, and you select equals, you are presented with a choice of how to set the date - either a Specific date or a list of Preset date ranges.
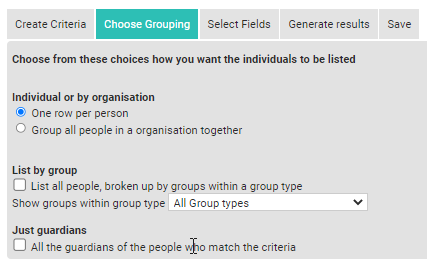
Choose Grouping
Once you have selected all of your criteria select the Choose Grouping tab. The grouping tab allows you to select how you would like data in the Report to be sorted. This can improve the readability of the report.
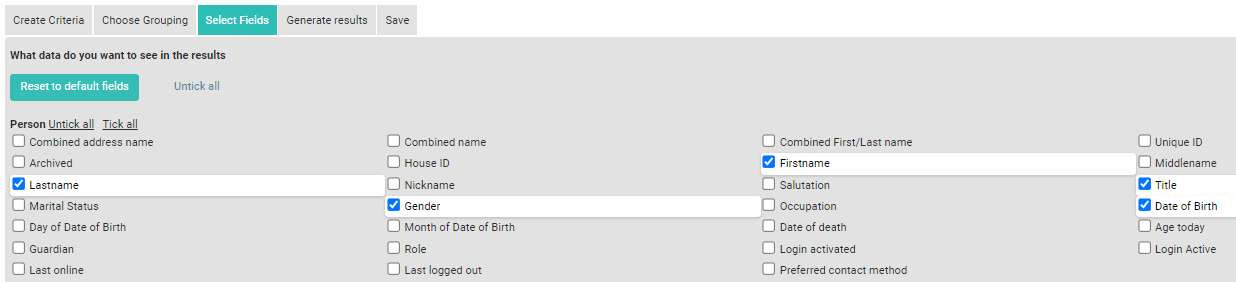
Select Fields
The Select Fields tab displays all of the data fields in your infoodle and provides you with the ability to select what details you want in the report.
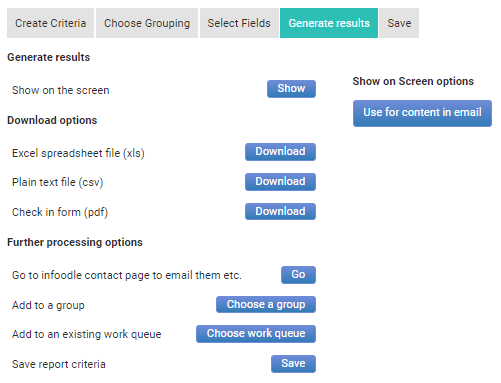
Generate Results
The Generate Results tab provides options for:
- Show - displaying the report directly on the screen
- Download options - exporting the report as an Excel or CSV file
- Further processing options
- use the report results as destinations for an email.
- add the results to an existing or new group. See Add to a group below.
- add the results to a Work Queue for later processing. See Add to an existing Work Queue below.
- Save report criteria - for information on this, see Saving a Report.
Add to a Group
Selecting the Choose a group button leads to a new screen where you can either add the report results (Contacts - either individuals, or organisations or households) to an existing group, or as the basis for the creation of a new group:
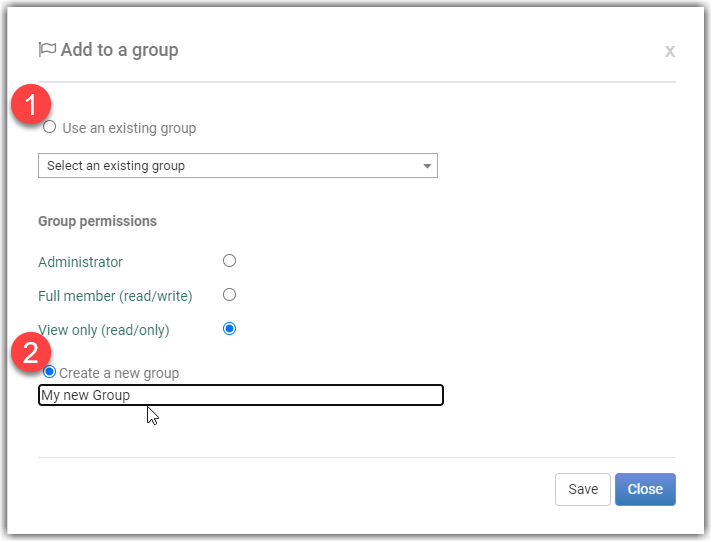
If you select the option to Create a new group, after you have entered a name for the new group and selected Save, the group, with the report results (individuals or organisations/households), will be created immediately.
Add to an existing Work Queue
A work queue is a list of people that require some manual processing. An example would be a follow up is required once a person has joined your organisation.
When you select this option the list of Work Queues that you have access to will be displayed:
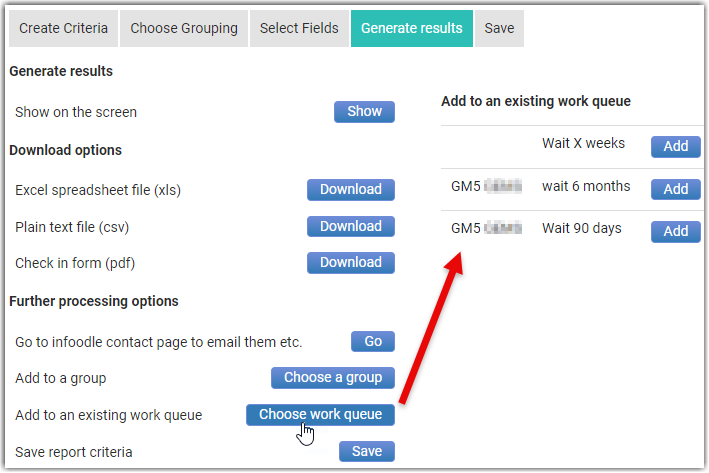
Select Add to add the report result contacts to the required Work Queue.
For information on printing the results, see: Printing a Report